I originally posted this at http://dtrace.org/blogs/brendan/2012/11/14/dtracing-in-anger.
My Macbook has becomeso sluggish that it feels like I'm typing ove a 9600 baud modem aagn. Or 2400. It's alo droping keystokes – which is irritatng as hll – so please forgive theapparent tyos and mistakes. It comes and goes each minute, so thiswhole post isn't too bad.
Usually I cn see what's wrng using my Top 10 DTrace scripts for Mac OS X, which have a focus on disk and file system issues. That's not the casehere.
Since this isinterferig wth localapplications, specifically, my keystokes as I type in vim, my suspects are CPU related. top(1) and DTrace profiling tells me this running:
# dtrace -n 'profile-99 { @[execname] = count(); } tick-1s { trunc(@, 5); printa(@); trunc(@); }'
dtrace: description 'profile-99 ' matched 2 probes
CPU     ID                    FUNCTION:NAME
  4  16339                         :tick-1s
  configd                                                          39
  firefox                                                          46
  Google Chrome H                                                  55
  SystemUIServer                                                   96  ← who r u??
  kernel_task                                                     444
Ok, so lets start with SystemUIServer, although I have no idea what it is, and there is no man page. A quick Internet search tells me it manages menu bar popups, and device removal (CDROMs, DVDs, USB). Suggestions include:
- reboot
- logout and log back in
- run killall SystemUIServer to kill it, and allow it to restart automatically.
- use command-R at startup and reinstall Lion OS X. "Everything solved."
That doesn't sound scientific. The only suggested root-cause I saw wasthat it had a "memory leak".
Lets look using DTrace.
First is to profile the on-CPU usage:
# dtrace -n 'profile-97 /execname == "SystemUIServer"/ { @[ustack()] = count(); }'
dtrace: description 'profile-97 ' matched 1 probe
dtrace: error on enabled probe ID 1 (ID 28: profile:::profile-97): invalid address (0x118ca2f00) in action #2
dtrace: error on enabled probe ID 1 (ID 28: profile:::profile-97): invalid address (0x7fff50b4b1f0) in action #2
dtrace: error on enabled probe ID 1 (ID 28: profile:::profile-97): invalid address (0x7fff50b4a130) in action #2
dtrace: error on enabled probe ID 1 (ID 28: profile:::profile-97): invalid address (0x7fff50b4afc0) in action #2
[...]
Ow. This was supposed to sample on-CPU user-level stacks, but I've hit the profiling stack-trace bug currently present on Mac OS X. Once this is fixed, this will be a lot easier to debug, as I can quickly roll Flame Graphs.
Now you get to see how I work around this on Mac OS X.
One level of stack works:
# dtrace -n 'profile-97 /execname == "SystemUIServer"/ { @[ustack(1)] = count(); }'
dtrace: description 'profile-97 ' matched 1 probe
^C
[...]
              CoreFoundation`CFRelease+0x46
                9

              libsystem_kernel.dylib`__workq_kernreturn+0xa
               10

              libobjc.A.dylib`objc::DenseMap, objc::DenseMapInfo >::LookupBucketFor(objc_object* const&, std::__1::pair*&) const+0x3a
               11

              libsystem_c.dylib`OSAtomicCompareAndSwap64Barrier$VARIANT$mp+0x8
               12

              libsystem_kernel.dylib`kevent+0xa
               26

              libsystem_kernel.dylib`mach_msg_trap+0xa
              151
This tells me mach_msg_trap() was on-CPU more than anyone else. Really wish I could see the full sttack trace, but can't with profiling due to that bug.
I can with the pid provider. This will begin to slow the target due to the ovrheads of pid tracing and user-level stack collection, but given how woefully slow this laptop is already, I don't mind.
# dtrace -n 'pid$target::mach_msg_trap:entry { @[ustack()] = count(); }' -p 177
dtrace: description 'pid$target::mach_msg_trap:entry ' matched 2 probes
^C
[...]
              libsystem_kernel.dylib`mach_msg_trap
              libsystem_kernel.dylib`mach_msg+0x46
              IOKit`io_iterator_next+0x4c
              IOKit`IOIteratorNext+0x11
              SystemConfiguration`findMatchingInterfaces+0xa4
              SystemConfiguration`_SCNetworkInterfaceCreateWithEntity+0x261
              SystemConfiguration`SCNetworkServiceGetInterface+0xab
              CoreWLAN`copyActiveWLANNetworkServices+0x115
              CoreWLAN`copyPrimaryActiveWLANNetworkService+0xc
              CoreWLAN`-[CWIPMonitor networkServiceID]+0x64
              CoreWLAN`-[CWIPMonitor ipv4StateConfig]+0x4d
              CoreWLAN`-[CWIPMonitor ipv4Routable]+0x21
              AirPort`0x000000011287e25f+0x30b
              Foundation`__NSThreadPerformPerform+0xe1
              CoreFoundation`__CFRUNLOOP_IS_CALLING_OUT_TO_A_SOURCE0_PERFORM_FUNCTION__+0x11
              CoreFoundation`__CFRunLoopDoSources0+0xf5
              CoreFoundation`__CFRunLoopRun+0x315
              CoreFoundation`CFRunLoopRunSpecific+0x122
              HIToolbox`RunCurrentEventLoopInMode+0xd1
              HIToolbox`ReceiveNextEventCommon+0x164
              676
Many stacks like the above were printed. They look truncated - they should go all the way back to thread creation.
Increasing stack levels:
# dtrace -x ustackframes=100 -n 'pid$target::mach_msg_trap:entry { @[ustack()] = count(); }' -p 177
dtrace: description 'pid$target::mach_msg_trap:entry ' matched 2 probes
[...]
              libsystem_kernel.dylib`mach_msg_trap
              libsystem_kernel.dylib`mach_msg+0x46
              IOKit`io_iterator_next+0x4c
              IOKit`IOIteratorNext+0x11
              SystemConfiguration`findMatchingInterfaces+0xa4
              SystemConfiguration`_SCNetworkInterfaceCreateWithEntity+0x261
              SystemConfiguration`SCNetworkServiceGetInterface+0xab
              CoreWLAN`copyActiveWLANNetworkServices+0x115
              CoreWLAN`copyPrimaryActiveWLANNetworkService+0xc
              CoreWLAN`-[CWIPMonitor networkServiceID]+0x64
              CoreWLAN`-[CWIPMonitor ipv4StateConfig]+0x4d
              CoreWLAN`-[CWIPMonitor ipv4Routable]+0x21
              AirPort`0x000000011287e25f+0x30b
              Foundation`__NSThreadPerformPerform+0xe1
              CoreFoundation`__CFRUNLOOP_IS_CALLING_OUT_TO_A_SOURCE0_PERFORM_FUNCTION__+0x11
              CoreFoundation`__CFRunLoopDoSources0+0xf5
              CoreFoundation`__CFRunLoopRun+0x315
              CoreFoundation`CFRunLoopRunSpecific+0x122
              HIToolbox`RunCurrentEventLoopInMode+0xd1
              HIToolbox`ReceiveNextEventCommon+0xa6
              HIToolbox`BlockUntilNextEventMatchingListInMode+0x3e
              AppKit`_DPSNextEvent+0x2ad
              AppKit`-[NSApplication nextEventMatchingMask:untilDate:inMode:dequeue:]+0x80
              AppKit`-[NSApplication run]+0x205
              SystemUIServer`0x000000010f0c747c+0x76
              libdyld.dylib`start
              SystemUIServer`0x1
             3010
That's better.
Airport? CoreWLAN? ipv4Routable? Is SystemUIServer doing something dumb with my WiFi?
Since that's just one stack out of hundreds, it's hard to know if this is the problem or a problem, without reading all the other stacks.
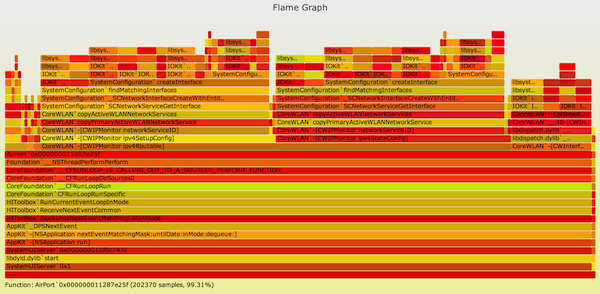
Fortunately there is a quick way to processall those stacks: Flame Graphs – not for thread samples, but for these function tracing stacks. Should still work.
# dtrace -x ustackframes=100 -n 'pid$target::mach_msg_trap:entry { @[ustack()] = count(); } tick-30s { exit(0); }' -p 177 -o out.SystemUIServer_stacks
dtrace: description 'pid$target::mach_msg_trap:entry ' matched 3 probes
# ~/Git/FlameGraph/stackcollapse.pl out.SystemUIServer_stacks2 | ~/Git/FlameGraph/flamegraph.pl > out.SystemUIServer_stacks.svg
The resulting SVG is:

Click for the interactive version. This confirmed that the mach_msg_trap()s were mostly AirPort.
I can dig around te stack more using dynamic tracing; taknig a quick look for strings to see if it sheds any light:
# dtrace -n 'pid$target::io_service_get_matching_services:entry { @[copyinstr(arg1)] = count(); }' -p 177
dtrace: description 'pid$target::io_service_get_matching_services:entry ' matched 1 probe
^C
  <dict><key>BSD Name</key><string>en1</string></dict>               51
  <dict><key>BSD Name</key><string>en2</string></dict>               51
  <dict><key>IOProviderClass</key><string>IOSerialBSDClient</string><key>IOTTYBaseName</key><string>Bluetooth-Modem</string></dict>               51
  <dict><key>IOProviderClass</key><string>IOSerialBSDClient</string><key>IOTTYDevice</key><string>Bluetooth-Modem</string></dict>               51
  <dict><key>BSD Name</key><string>en0</string></dict>               52
  <dict><key>BSD Name</key><string>fw0</string></dict>               52
  <dict><key>IOProviderClass</key><string>IOBluetoothHCIController</string></dict>              102
  <dict><key>IOProviderClass</key><string>IO80211Interface</string></dict>
       1917
Given that I'm not really doing anything with the WiFi, that it's so busy managing interfaces is starting to look like a bug. Possibly a memory leak too, as SystemUIServer is at 600 Mbytes RSS.
Opening the WiFi menu results in muchspinning beachball. As anexerient, I'l tun off WiFi.
...
Hooray! I can type again!
Turning WiFi back on returned the issue soon after. I did resort to the "killall SystemUIServer", which appears to have returned the laptop back to normal, while on WiFi.
I can keeping digging further in the stack when this issue returns, and browse the parts of this that are open source on Apple's website, and probably put my finger on the root cause. But this has been a distraction - I have real work to get back to doing.
And hey WindowServer – don't make me sic the pony on you, too.

